Economy · 3 minutes read
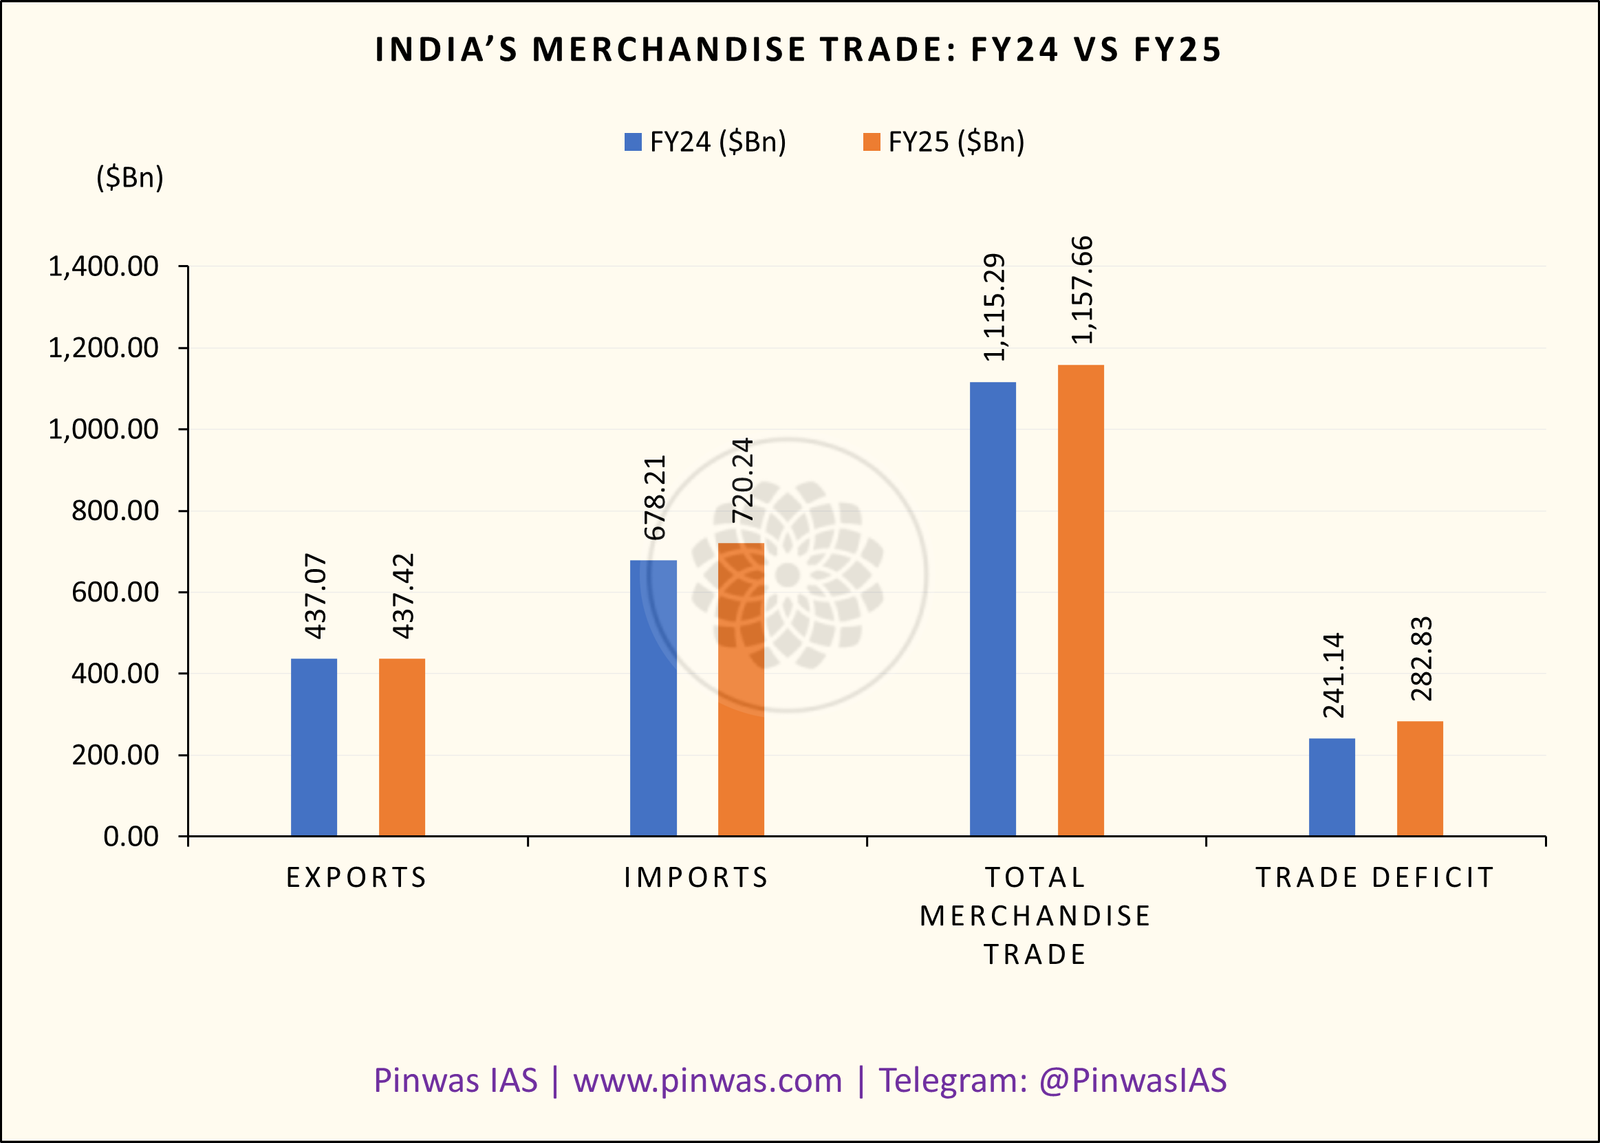
India’s Merchandise Trade in FY 2024–25 exhibited a mixed trajectory — while exports remained almost stagnant, imports rose sharply, leading to a significant widening of the trade deficit.
According to official data available on the PIB website, India’s merchandise exports totaled USD 437.42 billion, while imports reached USD 720.24 billion in FY 2024-25. During this period, the United States ranked as India’s largest export destination, with China serving as the largest source of imports.
India’s Merchandise Trade: FY24 vs FY25
| Indicator | FY 2023–24 ($Bn) | FY 2024–25 ($Bn) | % Change |
|---|---|---|---|
| Exports | 437.07 | 437.42 | ⬆️ 0.08% |
| Imports | 678.21 | 720.24 | ⬆️ 6.20% |
| Total Merchandise Trade | 1,115.29 | 1,157.66 | ⬆️ 3.80% |
| Trade Deficit | 241.14 | 282.83 | ⬆️ 17.29% |
India’s Top 5 Export Commodities (FY25)
| Rank | Commodity | Value ($Bn) | % Share of Total Exports |
|---|---|---|---|
| 1 | Engineering Goods | 116.67 | 26.67% |
| 2 | Petroleum Products | 63.34 | 14.48% |
| 3 | Electronic Goods | 31.24 | 7.15% |
| 4 | Drugs & Pharmaceuticals | 27.91 | 6.38% |
| 5 | Gems & Jewellery | 26.18 | 5.99% |
India’s Top 5 Import Commodities (FY25)
| Rank | Commodity | Value ($Bn) | % Share of Total Imports |
|---|---|---|---|
| 1 | Petroleum, Crude & Products | 210.56 | 29.24% |
| 2 | Electronic Goods | 81.73 | 11.35% |
| 3 | Machinery, Electrical & Non-Electrical | 49.83 | 6.92% |
| 4 | Gold | 43.98 | 6.11% |
| 5 | Coal, Coke & Briquettes, etc. | 40.91 | 5.68% |
India’s Top 5 Export Destinations (Nations) in FY25
| Rank | Country | Export Value ($Bn) | % Share of Total Exports |
|---|---|---|---|
| 1 | United States | 86.51 | 19.78% |
| 2 | United Arab Emirates | 36.64 | 8.37% |
| 3 | Netherlands | 22.76 | 5.20% |
| 4 | United Kingdom | 14.55 | 3.33% |
| 5 | China (P.R.) | 14.25 | 3.26% |
India’s Top 5 Export Destinations (Regions) in FY25
| Regions | Export Value ($Bn) | % Share in Total Exports * |
|---|---|---|
| EUROPE | 98.34 | 22.68% |
| NAFTA | 96.48 | 22.25% |
| WANA | 71.24 | 16.43% |
| ASEAN | 38.96 | 8.99% |
| AFRICA | 35.75 | 8.25% |
* The value of “Total Exports” used for determining the share of various regions is $433.56 billion, rather than $437.42 billion.
The description of the regions listed in the table above is as follows:
- NAFTA: North American Free Trade Agreement → 3 countries
- Europe: 38 countries/territories
- WANA: West Asia North Africa → 18 countries
- ASEAN: Association of Southeast Asian Nations → 10 countries
- Africa – 48 countries/territories
India’s Top 5 Import Source Countries (FY25)
| Rank | Country | Import Value ($Bn) | % Share of Total Imports |
|---|---|---|---|
| 1 | China (P.R.) | 113.46 | 15.75% |
| 2 | Russia | 63.85 | 8.86% |
| 3 | United Arab Emirates | 63.42 | 8.81% |
| 4 | United States | 45.33 | 6.29% |
| 5 | Saudi Arabia | 30.12 | 4.18% |
Top 10 States/UTs of India by Export Value (FY 2024–25)
| Rank | State/UT | Export Value ($Bn) | % Share in Total Exports |
|---|---|---|---|
| 1 | Gujarat | 116.33 | 29.88% |
| 2 | Maharashtra | 65.86 | 16.92% |
| 3 | Tamil Nadu | 52.07 | 13.38% |
| 4 | Karnataka | 30.48 | 7.83% |
| 5 | Uttar Pradesh | 21.98 | 5.65% |
| 6 | Andhra Pradesh | 20.78 | 5.34% |
| 7 | Telangana | 19.12 | 4.91% |
| 8 | West Bengal | 12.67 | 3.25% |
| 9 | Odisha | 10.09 | 2.59% |
| 10 | Madhya Pradesh | 7.82 | 2.01% |
India’s Top 5 Crude Oil Import Source Countries (FY25)
| Rank | Country | Share of Total Crude Oil Imports (By Value) | YoY Growth (%) |
|---|---|---|---|
| 1 | Russia | 35.15% | +8.17 |
| 2 | Iraq | 19.12% | –5.34 |
| 3 | Saudi Arabia | 14.04% | –7.43 |
| 4 | UAE | 9.69% | +54.73 |
| 5 | USA | 4.58% | +30.34 |
- Key highlights:
- India’s total crude oil imports amounted to USD 143.1 billion in FY25, representing a 2.72% increase over FY24.
- The highest rise in crude oil imports to India was from Argentina (~9,227k%), while the largest decline was from Greece (~77%), on a YoY basis.
- India’s crude oil import dependency was 88.2% in FY25.
India’s Top 5 LNG Import Source Countries (FY25)
| Rank | Country | Share of Total LNG Imports (By Value) | YoY Growth (%) |
|---|---|---|---|
| 1 | Qatar | 42.92% | +2.05 |
| 2 | United States | 16.55% | +74.38 |
| 3 | UAE | 13.73% | +13.94 |
| 4 | Oman | 7.04% | +94.78 |
| 5 | Nigeria | 4.72% | +19.45 |
- Key highlights:
- India’s total LNG imports amounted to USD 14.9 billion in FY25, representing an 11.11% increase over FY24.
- The highest rise in LNG imports to India was from Oman (~95%), while the largest decline was from France (~75%), on a YoY basis.
- India’s LNG import dependency was 50.5% in FY25.
India’s merchandise trade pattern in FY 2024–25 highlights a stagnant export performance amid rising import dependence, resulting in a sharply widening trade deficit. This underscores the need to diversify export markets, move up the value chain, and substitute critical imports through domestic production under initiatives such as Make in India and the Production Linked Incentive (PLI) schemes.
Sources: PIB | NIRYAT Portal | TRADESTAT
Subscribe: Telegram Channel ↗️
Join: Telegram Group ↗️